Further Curve Sketching
Accurate curve sketching combines algebra, limits and calculus. A successful sketch must show the domain, intercepts, symmetry, asymptotes, stationary points, monotonic intervals, concavity and end behaviour.
1. Domain and intercepts
Begin by finding all values for which the function is defined. Exclude zeros of denominators, require radicands of even roots to be non-negative, and require logarithm arguments to be positive. Find the y-intercept from f(0), when defined, and x-intercepts by solving f(x)=0.
2. Symmetry
- If f(−x)=f(x), the graph is even and symmetric about the y-axis.
- If f(−x)=−f(x), the graph is odd and symmetric about the origin.
- A rational graph may have a centre of symmetry at the intersection of its asymptotes.
3. Asymptotes
A vertical asymptote x=a commonly occurs where the denominator is zero and |f(x)|→∞. A horizontal asymptote y=L occurs if f(x)→L as x→±∞. For an oblique asymptote y=mx+c, find
m = lim f(x)/x, c = lim[f(x)−mx]
when these limits are finite. Polynomial division is often the fastest method for rational functions.
4. Monotonicity and stationary points
Compute f′(x). The curve increases where f′(x)>0 and decreases where f′(x)<0. A stationary point satisfies f′(x)=0. Use a sign table to classify it as a local maximum, local minimum or stationary point of inflection.
5. Concavity and points of inflection
The graph is concave upward where f″(x)>0 and concave downward where f″(x)<0. A point of inflection requires a change of concavity; merely solving f″(x)=0 is not enough.
6. Variation table and rational example
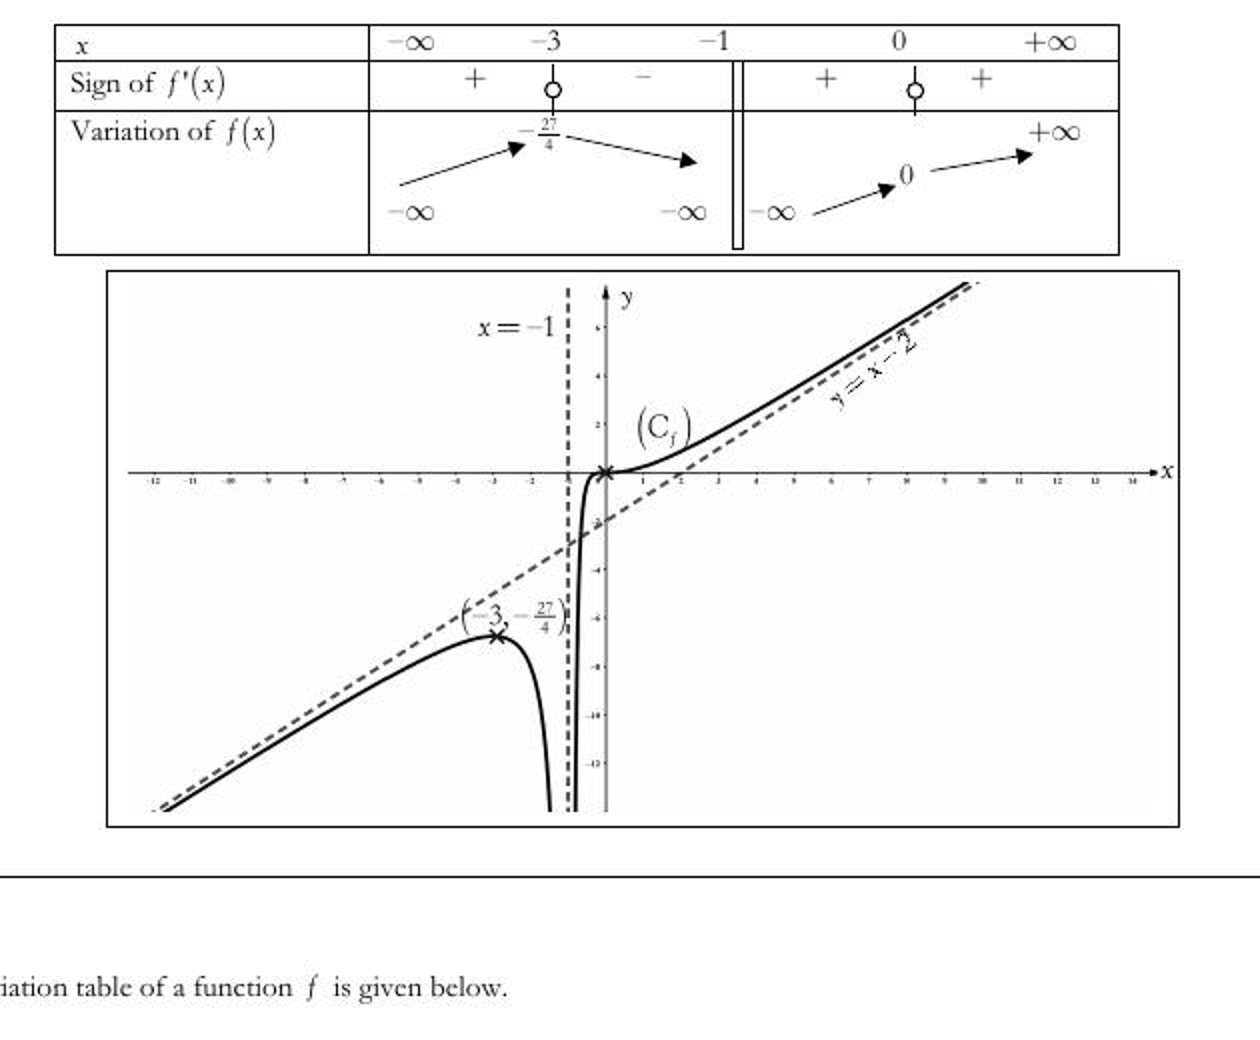
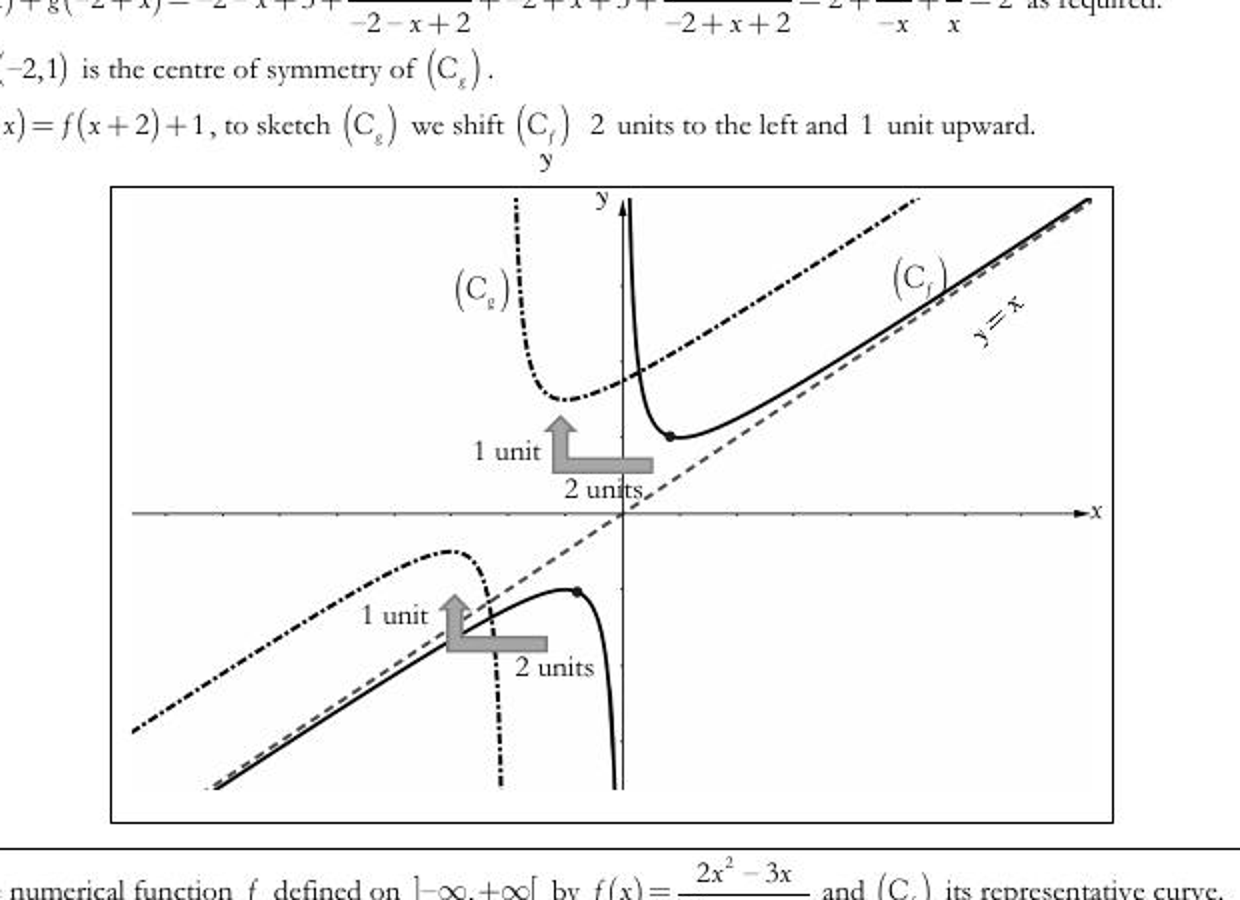
A variation table records critical values, discontinuities, derivative signs and corresponding function values. The diagram below illustrates a rational curve with a vertical and an oblique asymptote.
7. Graph transformations
If y=f(x), then y=f(x−a)+b shifts the graph a units right and b units up. The graph of y=af(x) is stretched vertically by factor |a| and reflected in the x-axis when a<0. The graph of y=f(kx) is scaled horizontally by factor 1/|k| and reflected in the y-axis when k<0.
8. A complete sketching checklist
- State the domain.
- Find intercepts and symmetry.
- Evaluate limits at excluded values and at infinity.
- Find all asymptotes.
- Determine f′, critical points and monotonic intervals.
- Determine f″, concavity and inflection points.
- Plot significant points and approach each asymptote from the correct side.
Worked example
For f(x)=x+1/(x+1), the domain excludes x=−1. Polynomial form immediately gives the oblique asymptote y=x, while x=−1 is vertical. Since f′(x)=1−1/(x+1)², stationary points occur at x=−2 and x=0. Their coordinates are (−2,−3) and (0,1). A sign table completes the sketch.
Practice questions
- Sketch y=(x²+1)/(x−1), showing every asymptote and stationary point.
- Find the centre of symmetry of y=(x²+5x+7)/(x+2).
- Sketch y=√(x²−4), stating its domain and asymptotes.
- Investigate y=x−sin2x on a suitable interval.
- Explain how the graph of y=f(x+3)−2 is obtained from y=f(x).