Statistics and Probability
Statistics is the collection, organisation and interpretation of data. Probability measures how likely an event is to occur on a scale from zero to one.
Learning objectives
After studying these notes, learners should be able to define the main terms, apply the central rules and formulas, solve structured examples and explain each answer clearly.
Key ideas
- Types and sources of data
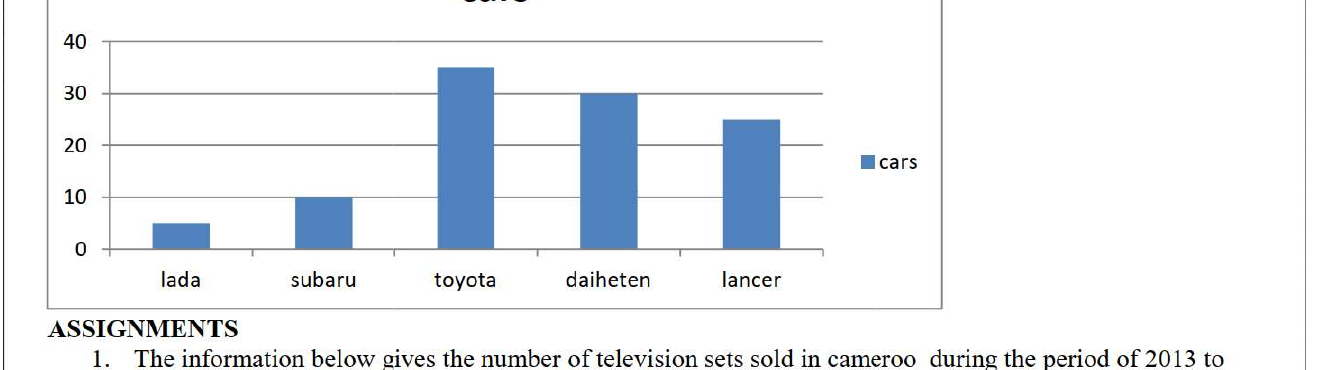
- Frequency tables, bar charts and pie charts
- Mean, median, mode and range
- Experimental and theoretical probability
- Mutually exclusive and complementary events
Essential rules and formulas
- Mean = sum of values / number of values
- Probability of an event = favourable outcomes / total equally likely outcomes
- P(not A) = 1 – P(A)
- For mutually exclusive events, P(A or B) = P(A) + P(B)
Worked example
For the values 4, 6, 6, 9 and 10, the mean is 35/5 = 7, the median is 6, the mode is 6 and the range is 10 – 4 = 6.
Study method
Begin every problem by listing the information supplied and identifying the rule that connects it to the unknown quantity. Keep algebraic steps on separate lines, include units where required and check that the final result is reasonable.
Practice questions
- Draw a bar chart for frequencies 5, 8, 12 and 7.
- A fair die is rolled. Find the probability of obtaining a prime number.
- Find the mean and median of 3, 7, 8, 8, 9, 13.
Revision checklist
- Can you state each definition without looking at the notes?
- Can you select the correct formula and substitute values accurately?
- Can you explain the reasoning behind each step?
- Can you solve a similar examination question independently?