A project management tool is used to visually communicate information (phases, tasks, resources) about a project. PERT and Gantt charts are the two most popular, both used to schedule tasks and keep a project on track.
PERT Chart
PERT stands for Program Evaluation and Review Technique. A PERT chart represents a project as a network diagram of numbered nodes (events or milestones) linked by directional lines (tasks). It helps set a realistic timetable, keep focus on the critical path, identify tasks to shorten, tasks that can run simultaneously, and slack time.
Key PERT Terminology
- Event: a point marking the start or completion of an activity, consuming no time or resources. A predecessor event immediately precedes another; a successor immediately follows it.
- Activity/task: the actual performance of work that consumes time and resources. A super task is one that no subtask can begin until it has started, e.g. an OS must load before application software can start.
- Critical task/path: a task (or series of tasks) that must be completed on schedule for the project to finish on time.
- Slack (float) time: the amount of time a task can be delayed without delaying the project finish date.
- Duration (D): the number of days/hours a task will take. Early Start (ES) and Early Finish (EF) are the earliest a task can start/finish (EF = ES + Duration). Late Start (LS) and Late Finish (LF) are the latest a task can start/finish without delaying the project.
- Forward pass: calculates each task’s early start/finish, working left to right. Backward pass: calculates late finish/start, working right to left from the project finish date.
- Milestone: a significant event in the project, usually the completion of a major component.
Worked Example
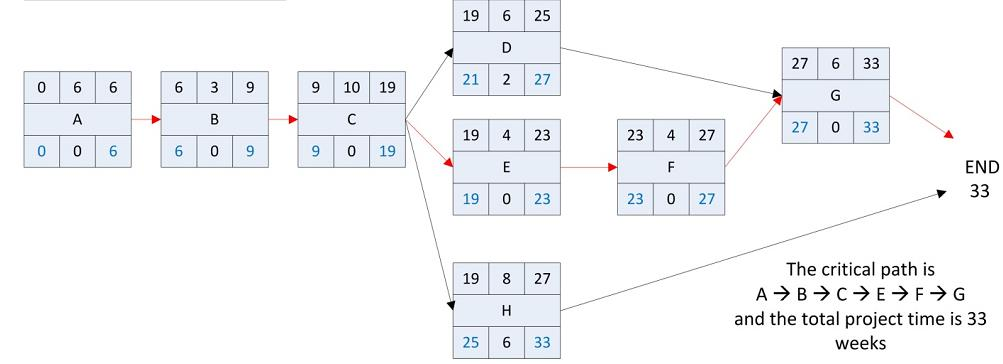
Given tasks A–H with durations and predecessors, the network diagram is drawn left to right following dependencies. The critical path is identified by finding the nodes where Early Start equals Late Start (no slack). In the example, the critical path is A → B → C → E → F → G, giving a total project time of 33 weeks; task H has 6 weeks of slack and could start any time between week 19 and week 25.
Gantt Chart
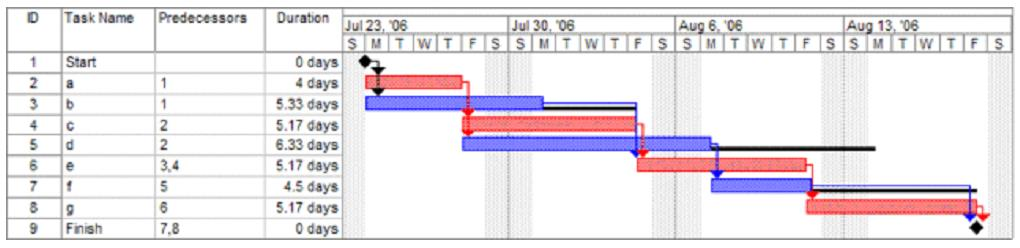
A Gantt chart, developed in 1918 by H.L. Gantt, is a graphic display of a schedule that helps plan, coordinate and track tasks. Activities are listed down the left side, dates run across the top, and planned durations are shown as horizontal bars – making it easy to see which tasks run simultaneously, though (unlike PERT) it does not show the critical path.
Difference Between PERT and Gantt Charts
- PERT charts display critical and non-critical tasks; Gantt charts do not show the critical path.
- PERT produces a more accurate expected time by averaging optimistic, most likely and pessimistic estimates; Gantt charts use a single time estimate.
- Gantt charts are straightforward and suit projects with little change; PERT charts are complex and tolerate more uncertainty.
- Gantt charts focus on the time required for each task; PERT focuses on the relationships and sequence between tasks.
- A PERT chart is a flow chart/network diagram; a Gantt chart is a bar chart.
Report Writing
A well-structured, well-written report can be a very influential document, used to suggest new ideas, ask people to accept a viewpoint, influence decisions, or ask people to choose between recommendations. The typical format of a project report is: Problem analysis/specification (introduction), Design (technical specification), Implementation (how the project was carried out), Testing (how you verified it worked as specified), and Evaluation (problems encountered and how they were solved).